High performance ZTNA can unlock substantial productivity gains; some workflows report up to 30× faster remote access. However, single-number latency claims often hide cold-start TLS costs, authentication delays, and wide geographic variation. Use the baseline metrics and pragmatic targets below to compare cloud-native ZTNA offerings and avoid letting marketing replace measurable outcomes.
What you need to know
Begin with a compact evaluation plan: measure the right metrics, validate architecture, run a focused POC, require raw telemetry, and translate targets into SLAs. Each step reduces the risk that vendor summaries or single-number claims will mask tail latency or last-mile effects.
High performance ZTNA: measurable metrics and SLAs
Raw latency numbers matter because they predict real user experience. No single industry standard exists for ZTNA, so buyers need a common language to compare vendors. Use percentile-based metrics and warm-versus-cold connection breakdowns as your baseline, and require geographic scope for every reported percentile. That separation makes apples-to-apples comparisons across regions and test conditions possible.
Measure metrics that map directly to user experience: P95 and P99 for warm and cold connections, TLS handshake and authentication time, time-to-first-byte, and time-to-first-meaningful-paint for web apps. Use these example targets as a starting point: interactive web UIs: P95 ≤ 50 ms and P99 ≤ 120 ms on warm connections; real-time media: RTT ≤ 50 ms, jitter ≤ 20 ms, and packet loss ≤ 0.5%; developer workflows (git, SSH): P95 ≤ 100 ms and combined TLS/auth under 150 ms. When drafting SLAs, define the percentile, connection state, and the geographic scope so guarantees are measurable and auditable.
Throughput and packet-level metrics complete the picture for capacity planning and collaboration quality. Ask for expected throughput per user (for example 1–5 Mbps for video, 200–500 Kbps for typical web users), aggregate capacity per PoP, and concurrent sessions per PoP targets. Track jitter and packet loss thresholds because even low average latency fails real-time voice and collaboration when jitter spikes or packets drop, and use those thresholds to size PoPs and plan surge capacity.
Require vendors to deliver exact telemetry: raw PCAPs or request logs, P95/P99 reports with warm-versus-cold breakdowns, TLS handshake and auth timings, TTFB and time-to-first-meaningful-paint, jitter and packet-loss histograms, throughput per user and aggregate, concurrent sessions per PoP, session-resumption rates, and geo-distribution. Warm-versus-cold separation and session-resumption numbers matter because cached sessions can hide real-world delays and skew perceived speed. Then use these metrics to drive the POC checklist below and validate vendor claims on your network.
Architectural foundations for speed without sacrificing security
Use these architectural checks during every demo or POC to verify claims. Look for evidence at the protocol, edge, and policy layers that the platform delivers low overhead while maintaining consistent security controls. When evaluating high performance ztna, require demonstrable metrics and operational details rather than relying on diagrams alone. For authoritative guidance on zero trust architecture principles, consult NIST SP 800-207.
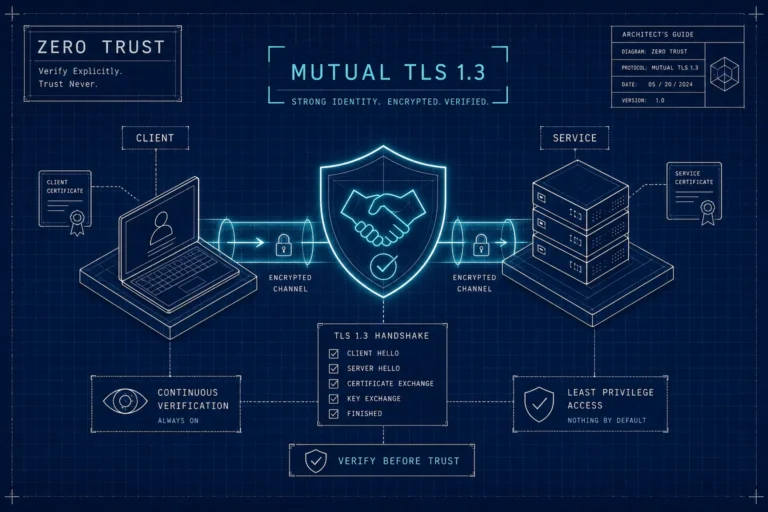
Mutual TLS 1.3 lowers handshake overhead compared with legacy TLS and can reduce round trips. Session resumption and short-lived keys cut repeated negotiation time for long-lived users. Verify certificate lifecycle automation so issuance and rotation don’t introduce manual delays, and instrument handshake timing to measure full versus resumed handshakes, failed resumptions, and 0-RTT acceptance alongside replay-protection behavior.
An elastic edge mesh removes centralized backhaul and accelerates the last mile when implemented at scale. Look for many PoPs with dynamic per-flow routing and local acceleration such as TCP tuning and WAN optimization to keep flows close to users. During a POC, probe PoP adjacency with synthetic tests and compare per-flow latency and throughput against a centralized backhaul model to quantify last-mile improvement. You can read more about how edge design and automated defenses improve performance in The Power of Edge Networking: Cloudbrink FAST Edges and Automated Moving Target Defense.
Microsegmentation enforces least privilege close to the resource while shrinking the inspection blast radius and reducing unnecessary round trips. Narrowing inline inspection scope improves performance while preserving strict access controls. As a demo checklist, validate mTLS handshake and resumption metrics, PoP adjacency and per-flow latency, and policy enforcement success rate and segmentation granularity, and use those checks to create pass/fail criteria and test scripts for your POC.
Design a focused POC to prove performance
Run a compact, repeatable POC that proves real user experience rather than relying on throughput graphs alone. Define a simple, reproducible topology: client locations (home, 4G/5G mobile, office LAN), an application tier (a cloud app region and an on-prem app), and one or two vendor edge nodes. Keep the scope tight so you can iterate quickly and validate high performance ZTNA claims with measured, comparable results.
Build representative workloads around clear user personas: remote home workers using browser and SaaS apps, mobile users running SSH and CI/CD agents, and in-office employees on VoIP and large file sync. For each persona, pick app types such as browser apps (HTTP/HTTPS), SSH/CI/CD (long-lived TCP), and VoIP (SIP/RTP). Run warm and cold tests after policy changes or new devices for cold starts and after repeated connections for warm runs, and use sample concurrent mixes such as small (20 interactive, 10 SSH, 5 VoIP for 30 minutes), medium (200 mixed for 1 hour), and stress (500+ sessions for 30 minutes with iterations).
Collect the right telemetry with concrete tools. Use iPerf3 for throughput, curl or httperf and WebPageTest for HTTP metrics, SIPp for VoIP load, traceroute or MTR for path analysis, and RUM or Catchpoint for geo-distributed experience. Capture vendor logs, auth traces, and packet captures for inspection timing, and focus on single-number outputs that map to SLAs: P95 latency, auth time, throughput per active user, packet loss percentage, VoIP jitter, and mean inspection processing time.
Score results with a weighted rubric and normalize to a VPN baseline so you measure delta rather than absolute claims. Example weights: latency 35%, auth time 20%, inspection overhead 15%, reliability 20%, operational fit 10%. Set pass thresholds such as P95 warm latency ≤ 50 ms for interactive apps, auth time ≤ 250 ms, inspection overhead ≤ 15 ms, success rate ≥ 99%, and VoIP jitter ≤ 30 ms, then use rankings to tune policies and scale the edge mesh before wider rollout.
Security controls that add latency and mitigation patterns
Security controls can add measurable overhead, so quantify that cost and keep protections enabled where risk justifies them. Common culprits include deep packet inspection, TLS inspection, DLP scanning, and inline threat emulation, each adding processing and queuing time per flow. Compare impact with controlled experiments: capture a baseline RTT, enable one control at a time, and record median and 95th-percentile added milliseconds across representative flows.
After you quantify costs, apply mitigation patterns that preserve security and speed. Use selective inspection to apply heavy checks only where risk justifies the CPU and latency cost, offload bulk checks to out-of-band scanning for large file transfers, and combine client-side enforcement with asynchronous enrichment so inline paths remain fast. Session caching, hardware crypto offload, and parallelized inspection further reduce per-packet CPU time and let you keep protections enabled without chasing minimal latency at the expense of coverage.
Tune policies for real-time and developer workflows instead of applying a single profile everywhere. Prioritize media and interactive sessions, apply lighter inspection to trusted CI/CD agents, and use ephemeral trust windows for automated pipelines so builds and tests stay fast while keeping auditability. Treat policy tuning as repeatable engineering work: measure, adjust thresholds, and track enforcement success and latency trends over time. For guidance on creating effective access policies.
Compare vendors on real tradeoffs, not marketing
Buying high performance ZTNA requires balancing latency, inspection depth, and operational overhead. Use a repeatable evaluation method: score each vendor on defined subcriteria from 0 to 10, apply weights, and sum to a 100-point scale. Keep the rubric public inside your organization so comparisons remain defensible across teams and procurement cycles. For a general industry perspective on zero trust principles.
Ask vendors to answer the following questions exactly and attach supporting evidence. Require replayable test scripts, raw logs, and clear topology details so their claims are reproducible from your client locations or an independent lab.
- What is your architecture: client connector, edge-proxy, or cloud-native? Provide diagrams and explain component responsibilities and where state and processing occur.
- What is your PoP footprint and the median PoP distance to our major user regions? List PoP locations and include sample latency measurements from those regions.
- Do you support mTLS 1.3, session resumption, and configurable cipher suites? Provide handshake logs from tests that demonstrate resumed and full-handshake timings.
- Describe your microsegmentation model: label-based, identity-driven, or tag-driven. Show policy examples and how segmentation maps to least-privilege enforcement.
- Can you share raw telemetry, PCAPs or timestamped logs, and your query schema? Explain retention, access controls, and how we can extract percentile and session-resumption metrics.
- Provide the exact test topology and scripts used for any benchmark. Include access to tools such as Packet Loss tools. Ensure we can reproduce those topologies and replay tests from our client locations.
To validate vendor benchmarks and third-party tests, require raw logs, replayable test scripts, and the vendor’s exact topology before accepting claims. Replay their scripts from your own client locations or an independent lab so last-mile effects appear, and ask for timestamped PCAPs or flow logs to cross-check latency, session-resumption rates, and error counts. Treat vendor warm-path numbers without reproducible methodology as signals for trend analysis but not as a procurement decision basis.
A sample vendor comparison rubric keeps choices objective. Use weights such as performance 40%, security 30%, observability 15%, and operational fit 15% to reflect your priorities.
For example, Cloudbrink might score performance 9/10, security 8/10, observability 8/10, and ops fit 9/10, yielding a weighted total around 86.5 out of 100. An inspection-heavy edge-proxy could score security 9 but performance 6, totaling around 78, and you can use the rubric to justify these tradeoffs and design the reproducible POC topology you will run. Independent benchmarks and press coverage can help validate claims; see Independent tests confirm 30x performance boost for secure remote access for one example of reproducible test results.
Make the shortlist and move to production
Operational checklist: translate POC success into a clear rollout plan that operations and security teams can execute. Document onboarding steps, identity and policy sync, endpoint agent deployment, monitoring integration, and updated runbooks before you flip the switch. Define rollback conditions up front so teams know when to stop a rollout and revert to the previous state.
Start the rollout with a phased plan that reduces blast radius and measures real user impact. Pilot 5 to 10 percent of users in a targeted business unit, expand to 25 percent with broader app coverage, and proceed to full rollout if metrics hold. At each stage verify device posture, policy enforcement, session stability, and user experience, and keep stakeholders informed with the telemetry captured during the POC.
SLOs and telemetry: demand clear SLO language in contracts and insist on raw telemetry access for independent review. Specify which percentiles matter (p50, p95, p99), define exactly how latency is measured (client-to-edge, edge-to-app, and last-mile), and require trial-extension or remediation clauses if measured performance misses targets. Those terms protect you when evaluating high performance ztna and let you verify vendor claims without relying only on vendor dashboards. For a concise explanation of percentile latency and why P99 matters for user experience, see what P99 latency means.
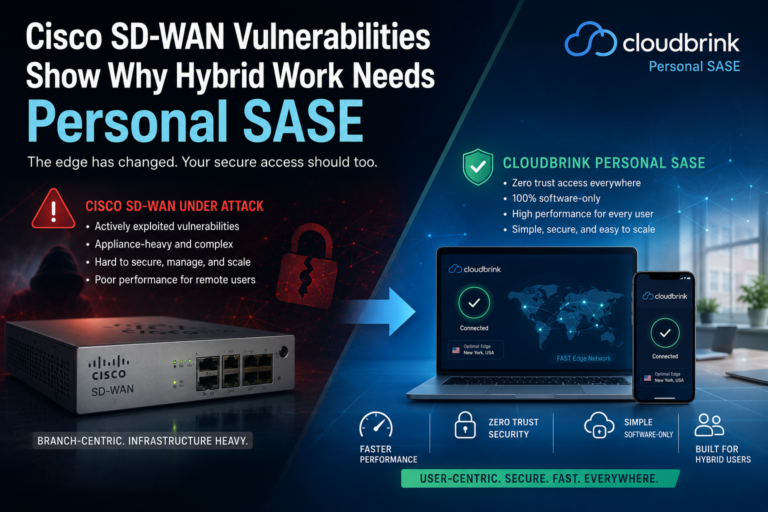
Shortlist Cloudbrink Personal SASE when you need low-latency ZTNA with strong control and simple operations. Cloudbrink uses mutual TLS 1.3 between edges, an elastic edge mesh, advanced microsegmentation, and last-mile network acceleration. In repeatable tests that mirror the POC above, that architecture delivered sub-20 ms latencies for many user-to-app hops while keeping edge-enforced controls and certificate-free policy management. If those results match your goals, proceed with procurement and schedule the production cutover using the rollout checklist. Read more about Cloudbrink’s PoP expansion in Cloudbrink’s 600th PoP gives it the edge.
Verify high performance ZTNA the right way
High performance ZTNA is measurable when you focus on the metrics that reflect real user experience. Start with P95 and P99 latency on warm and cold paths and compare those numbers to baseline VPN figures so you measure user impact rather than aggregate averages. Check architectural signals as well: look for an elastic edge mesh and localized last-mile acceleration that remove centralized backhaul and reduce hops.
Schedule a focused 48-hour POC that runs representative apps from three client locations, captures P95/P99 warm-path latency, and compares session-level throughput and connection times. Use the reproducible checklist and scoring rubric above to compare vendors and convert targets into SLAs you can enforce.